Sentinel
Finding the AWS service behind a change in the bill.
From bill to service
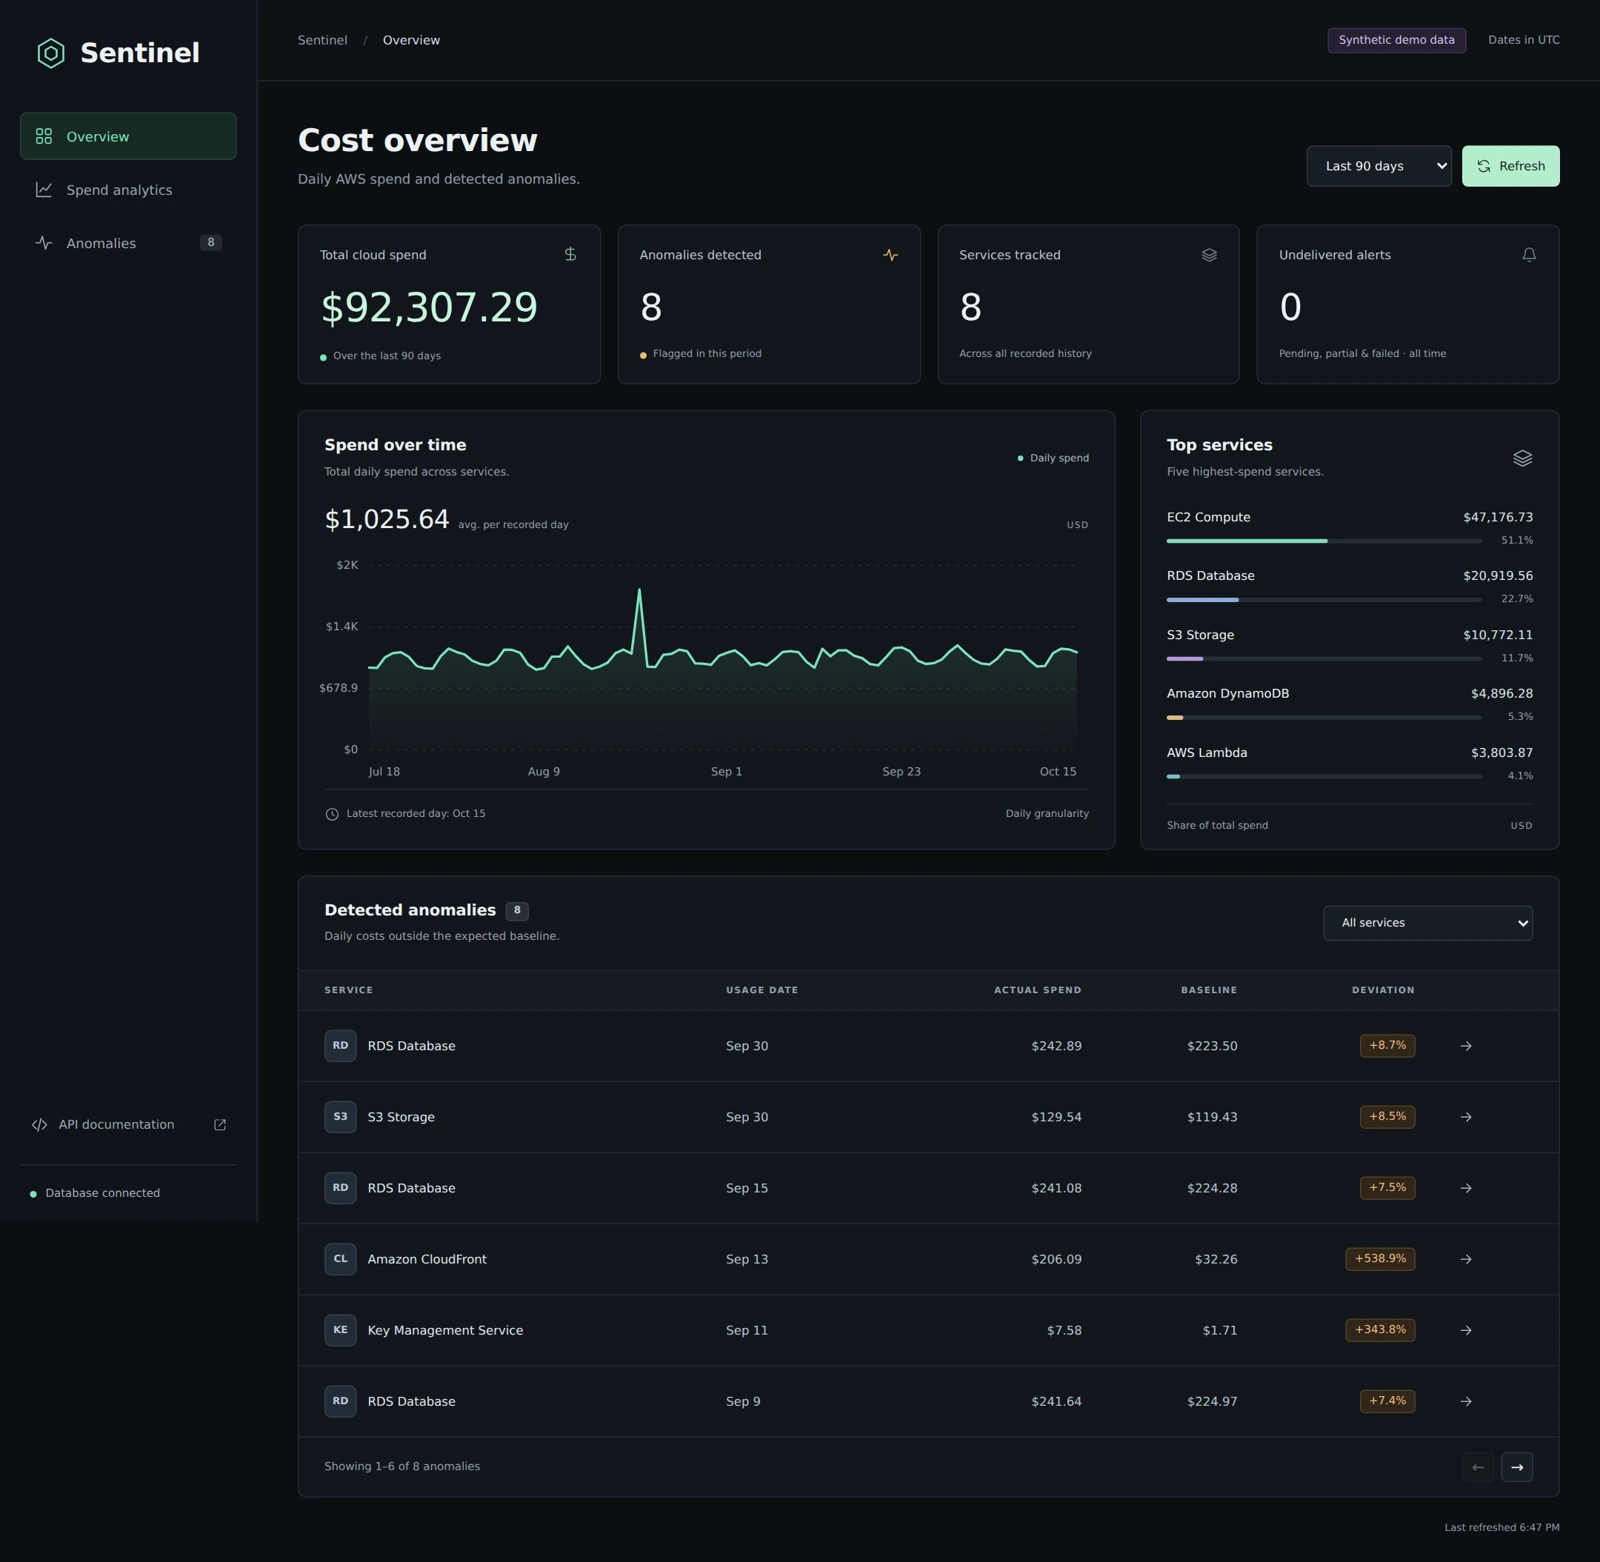
A higher total says little about what changed. Sentinel pulls daily costs from AWS Cost Explorer and keeps a separate spending history for each service.
The dashboard lets you switch between 7, 30, and 90 days of spend. Open a flagged day to see what the service cost, what the detector expected, and how far apart the two figures were.
GitHub repository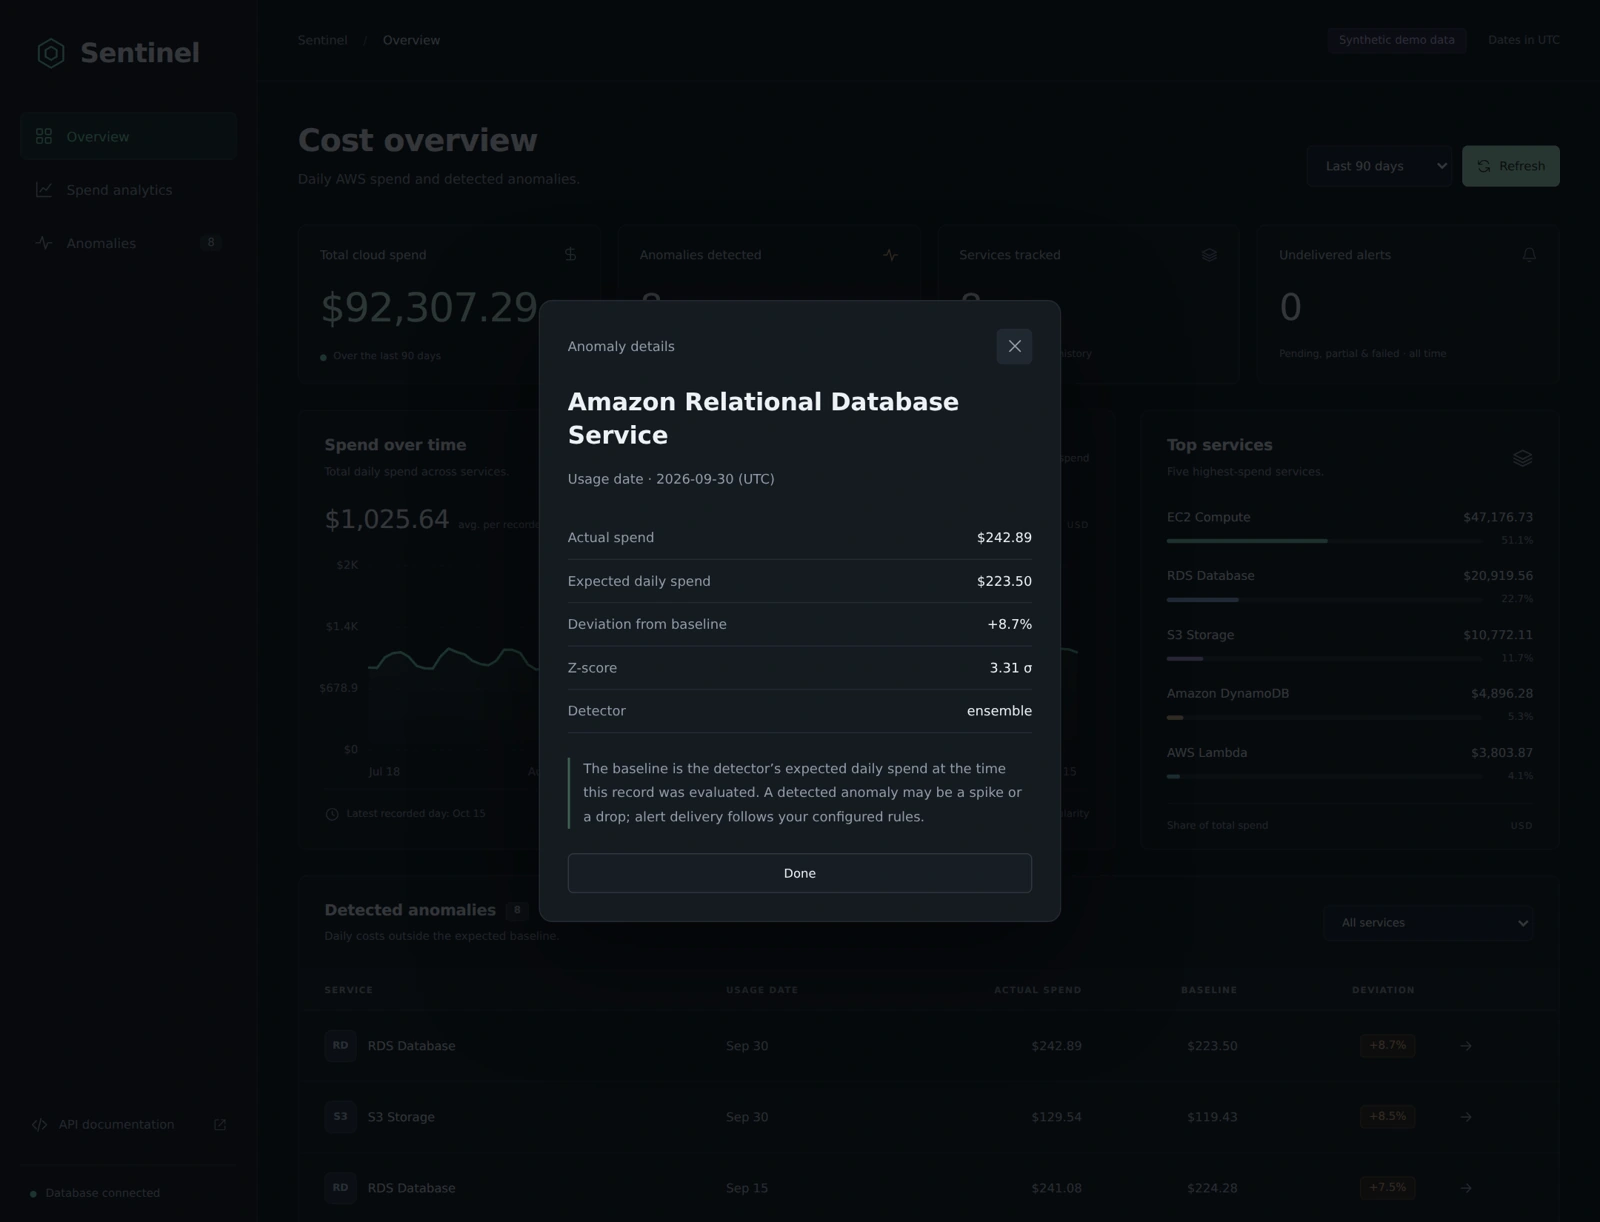
Choosing when to alert
Each new daily cost is scored against a trailing median before it enters the history. One expensive day can then have little effect on what counts as typical for the next.
A second model checks borderline spikes and a dollar threshold filters out small changes. When a spike qualifies, the poller can send its details by webhook or email. A per-service cooldown keeps a sustained spike from generating repeated alerts.